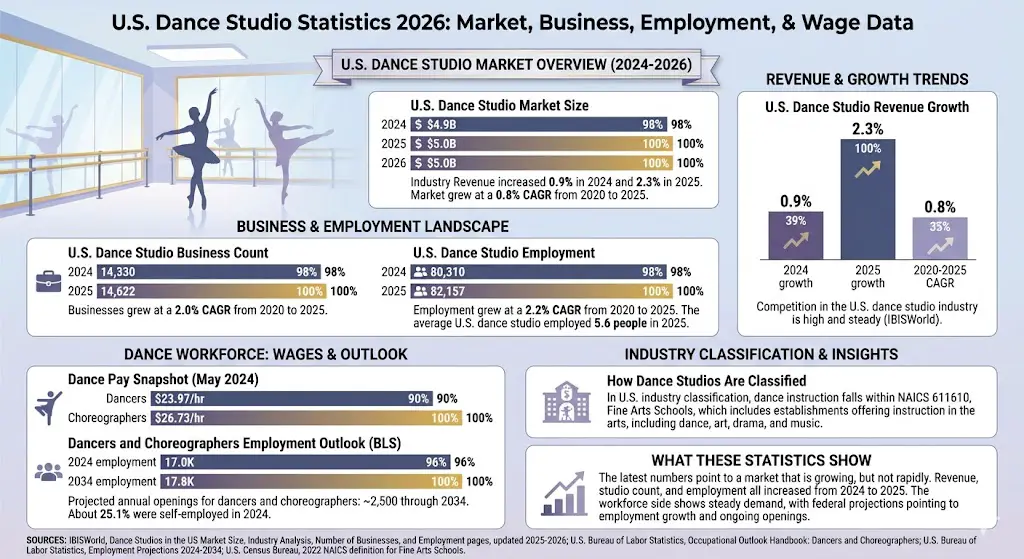
These dance studio statistics highlight the latest U.S. industry figures on market size, business count, employment, wages, and labor outlook. The strongest current studio-specific data is U.S.-based, so this overview focuses on the U.S. market.
Max = $26.73/hr. Widths: Dancers 89.67%, Choreographers 100.00%
Dancers and Choreographers Employment Outlook
Label
Bar
Value
2024 employment
17.0K
2034 employment
17.8K
Max = 17.8K. Widths: 2024 employment 95.51%, 2034 employment 100.00%
How Dance Studios Are Classified
In U.S. industry classification, dance instruction falls within NAICS 611610, Fine Arts Schools, which includes establishments offering instruction in the arts, including dance, art, drama, and music. In practice, many dance schools and studios are counted within broader fine arts instruction categories even when market research firms isolate dance studios as a distinct business segment.
What These Dance Studio Statistics Show
The latest numbers point to a market that is growing, but not rapidly. Revenue, studio count, and employment all increased from 2024 to 2025, while the average studio remained a relatively small operation with fewer than six employees.
The workforce side of the market also shows steady demand. Pay levels for dancers and choreographers are still modest compared with many other skilled occupations, but federal projections still point to employment growth, ongoing openings, and a meaningful self-employed segment.
Sources
IBISWorld, Dance Studios in the US Market Size, Industry Analysis, Number of Businesses, and Employment pages, updated 2025-2026
U.S. Bureau of Labor Statistics, Occupational Outlook Handbook: Dancers and Choreographers
U.S. Bureau of Labor Statistics, Employment Projections 2024-2034
U.S. Census Bureau, 2022 NAICS definition for Fine Arts Schools
Uncover the top 10 adjustable bookshelf speaker stands that perfectly blend optimal sound and style, and discover which ones will elevate your audio experience.
Maximize your home cinema's audio potential with the 10 best acoustic panels that promise to transform your sound experience—discover which ones make the cut!
Outstanding sound quality and clarity await with the 10 best planar magnetic speakers of 2025—discover which models redefine your listening experience.
Learn about the top 10 wrist and hand exercisers for musicians that can boost your performance and keep injuries at bay—discover which ones are best for you!