These ballet industry statistics show how the sector is performing across company finances, labor benchmarks, leadership representation, programming patterns, and audience development.
ballet industry statistics
Because ballet is usually measured through nonprofit company filings, labor data, and field research rather than one single market category, the most useful benchmarks come from company financial statements and dance-industry reports.
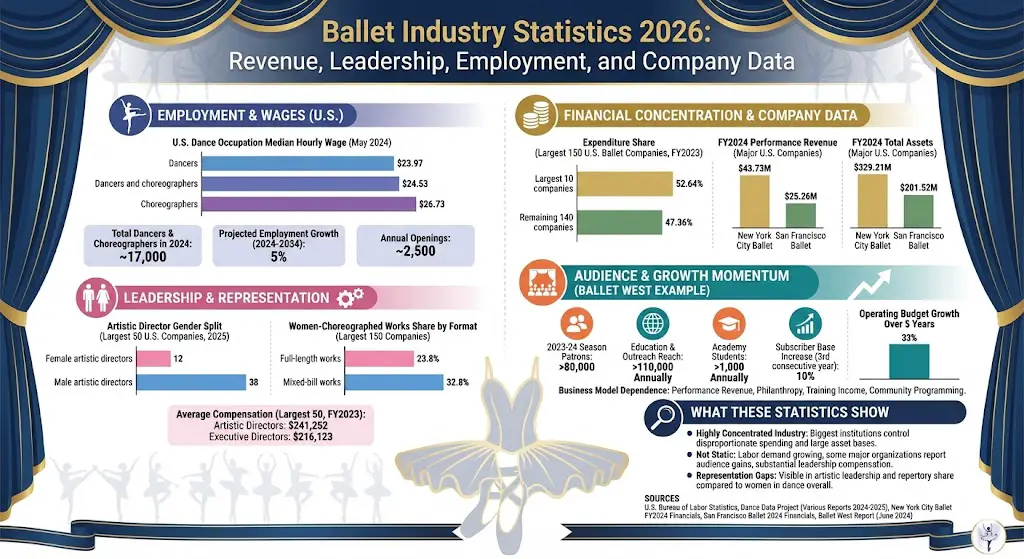
The U.S. had about 17,000 dancers and choreographers in 2024, with employment projected to grow 5% from 2024 to 2034 and about 2,500 openings per year.
The median hourly wage was $23.97 for dancers and $26.73 for choreographers in May 2024.
Dance Data Project says the Largest 10 U.S. ballet companies accounted for 52.64% of total expenditure among the Largest 150 in FY2023.
Within the Largest 50 U.S. ballet companies, there were 12 female and 38 male artistic directors in 2025.
Women-choreographed works accounted for 23.8% of full-length works and 32.8% of mixed-bill works among the Largest 150 U.S. ballet and classically based companies.
In FY2023, artistic directors in the Largest 50 earned average compensation of $241,252, versus $216,123 for executive directors.
New York City Ballet reported $43.73 million in performance ticket sales and tour fees in FY2024 and total assets of $329.21 million.
San Francisco Ballet reported $24.72 million in San Francisco performance revenue, $0.54 million in touring revenue, and total assets of $201.52 million in FY2024.
Ballet West said its 2023–24 season drew more than 80,000 patrons, while its education and outreach programs reach more than 110,000 children and adults annually.
Ballet West also said its operating budget grew 33% over five years and its subscriber base increased 10% for a third consecutive year.
U.S. Dance Occupation Median Hourly Wage
Label
Bar
Value
Dancers
$23.97
Dancers and choreographers
$24.53
Choreographers
$26.73
Max = $26.73. Widths: Dancers 89.67%, Dancers and choreographers 91.77%, Choreographers 100.00%
Expenditure Share Among the Largest 150 U.S. Ballet Companies
Label
Bar
Value
Largest 10 companies
52.64%
Remaining 140 companies
47.36%
Max = 52.64%. Widths: Largest 10 companies 100.00%, Remaining 140 companies 89.97%
Artistic Director Gender Split in the Largest 50 U.S. Ballet Companies
Label
Bar
Value
Female artistic directors
12
Male artistic directors
38
Max = 38. Widths: Female artistic directors 31.58%, Male artistic directors 100.00%
Women-Choreographed Works Share by Format
Label
Bar
Value
Full-length works
23.8%
Mixed-bill works
32.8%
Max = 32.8%. Widths: Full-length works 72.56%, Mixed-bill works 100.00%
FY2024 Performance Revenue at Two Major U.S. Ballet Companies
Label
Bar
Value
New York City Ballet
$43.73M
San Francisco Ballet
$25.26M
Max = $43.73M. Widths: New York City Ballet 100.00%, San Francisco Ballet 57.78%
FY2024 Total Assets at Two Major U.S. Ballet Companies
Label
Bar
Value
New York City Ballet
$329.21M
San Francisco Ballet
$201.52M
Max = $329.21M. Widths: New York City Ballet 100.00%, San Francisco Ballet 61.21%
Ballet Audience and Education Momentum
One of the clearest current growth signals comes from Ballet West. The company said its 2023–24 season attracted more than 80,000 patrons, posted record-breaking attendance and revenue, and marked a fourth straight year with a balanced budget. It also reported that its operating budget has grown 33% over five years and that its subscriber base increased 10% for a third consecutive year.
Education is also a major part of the ballet business model. Ballet West said its education and outreach programs reach more than 110,000 children and adults each year, while its academy serves more than 1,000 students annually. That matters because many ballet organizations depend on a mix of performance revenue, philanthropy, training income, and community programming rather than ticket sales alone.
What These Ballet Industry Statistics Show
The ballet industry remains highly concentrated. The biggest institutions still control a disproportionate share of spending, and major U.S. companies maintain asset bases and earned revenue levels that are large relative to the size of the overall dancer labor market.
At the same time, the numbers show that ballet is not static. Labor demand is still expected to grow, some major organizations are reporting audience gains, and leadership compensation remains substantial. But representation gaps are still visible in artistic leadership and repertory share, especially when comparing the percentage of women in dance overall with the percentage of women directing the largest ballet companies.
Sources
U.S. Bureau of Labor Statistics, Dancers and Choreographers Occupational Outlook Handbook, updated 2025
Dance Data Project, Largest 150 U.S. Ballet and Classically Based Companies 2025
Dance Data Project, Transparency and Methodology Statement
Dance Data Project, Artistic and Executive Compensation Report 2024
New York City Ballet, FY2024 Audited Financial Statements
San Francisco Ballet, 2024 Year-End Financial Statements & Report
Ballet West, Ballet West Hits Historic Highs, June 24, 2024
With the right overhead stereo, your golf game can transform into a musical journey—discover which top models can elevate your experience on the course.