These dance education statistics bring together the latest widely cited U.S. data on school access, dance course availability, adult dance learning, higher education degree output, and the studio market that supports much of dance training outside the school day.
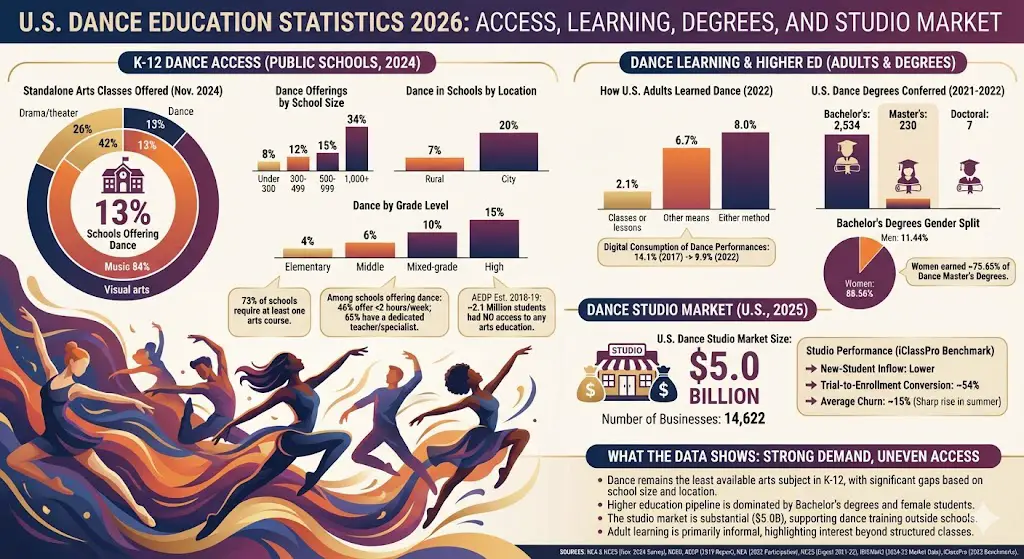
In November 2024, 93% of U.S. public schools offered at least one standalone arts class during the regular school day, but only 13% offered dance.
Only 7% of rural public schools offered dance, compared with 20% of schools in cities.
Just 8% of schools with fewer than 300 students offered dance, versus 34% of schools with 1,000 or more students.
73% of public schools required students to take at least one arts course.
Among schools that provided dance classes, 46% offered less than 2 hours of dance instruction per week.
Among schools offering dance, 65% had a full- or part-time teacher or specialist assigned to teach it.
Across 17 states in the Arts Education Data Project, dance was offered in 15% of high schools, 6% of middle schools, and 4% of elementary schools in 2018-2019.
The Arts Education Data Project estimated that 2,095,538 U.S. public-school students had no access to any arts education in 2018-2019.
In 2022, 2.1% of U.S. adults learned dance through classes or lessons, while 8.0% learned dance either through classes or by other means.
U.S. colleges and universities conferred about 2,534 dance bachelor’s degrees, 230 master’s degrees, and 7 doctoral degrees in 2021-2022.
Women earned about 88.56% of dance bachelor’s degrees in 2021-2022.
The U.S. dance studio market reached $5.0 billion in 2025 across 14,622 businesses.
K-12 Dance Education Access Statistics
Recent federal school data shows that dance remains the least available standalone arts subject in U.S. public schools. Music and visual arts are widely offered, while dance is still concentrated in larger schools, city schools, and higher grade levels.
U.S. public schools offering standalone arts classes by discipline
Label
Bar
Value
Music
84%
Visual arts
82%
Media arts
42%
Drama/theater
26%
Dance
13%
Max = 84%. Widths: Music 100.00%, Visual arts 97.62%, Media arts 50.00%, Drama/theater 30.95%, Dance 15.48%
Dance offered in schools by grade level
Label
Bar
Value
Elementary schools
4%
Middle schools
6%
Mixed-grade schools
10%
High schools
15%
Max = 15%. Widths: Elementary schools 26.67%, Middle schools 40.00%, Mixed-grade schools 66.67%, High schools 100.00%
Dance offerings by school size
Label
Bar
Value
Under 300 students
8%
300-499 students
12%
500-999 students
15%
1,000+ students
34%
Max = 34%. Widths: Under 300 students 23.53%, 300-499 students 35.29%, 500-999 students 44.12%, 1,000+ students 100.00%
The same 2024 federal survey found clear access gaps around dance. Rural schools were much less likely to offer dance than city schools, at 7% versus 20%. Schools serving more than 75% students of color were more likely to offer dance than schools with 25% or fewer students of color, at 20% versus 6%, but they were less likely to offer arts instruction overall. The survey also found that 46% of schools providing dance classes offered less than 2 hours of dance instruction per week, and 65% of schools offering dance had a full- or part-time teacher or specialist assigned to it.
Dance Learning Statistics
Dance learning is not limited to formal school programs. Federal arts participation data shows a much larger share of adults learned dance informally than through structured classes or lessons, which helps explain why school and studio access still matter for students who want sequenced instruction.
:contentReference[oaicite:6]{index=6}
How U.S. adults learned dance in 2022
Label
Bar
Value
Classes or lessons
2.1%
Other means
6.7%
Either method
8.0%
Max = 8.0%. Widths: Classes or lessons 26.25%, Other means 83.75%, Either method 100.00%
The same 2022 arts participation report also showed that digital consumption of dance performances fell from 14.1% of adults in 2017 to 9.9% in 2022, suggesting that dance engagement remained meaningful but did not hold all of its pandemic-era media reach.
Higher Education Dance Statistics
College dance remains a relatively small but specialized part of U.S. higher education. Federal completions data shows bachelor’s degrees dominate the pipeline, while graduate degree output is far smaller.
U.S. dance degrees conferred in 2021-2022
Label
Bar
Value
Bachelor’s
2,534
Master’s
230
Doctoral
7
Max = 2,534. Widths: Bachelor’s 100.00%, Master’s 9.08%, Doctoral 0.28%
Gender concentration in dance degrees also remains pronounced. Based on the 2021-2022 NCES completions table, women earned about 88.56% of dance bachelor’s degrees and about 75.65% of dance master’s degrees.
Dance Studio Education Market Statistics
Outside the school system, dance education is also shaped by the health of the studio market. IBISWorld estimated the U.S. dance studio market at $4.9 billion in 2024 and $5.0 billion in 2025, while the number of dance studio businesses rose from 14,330 in 2024 to 14,622 in 2025.
Recent youth activity center benchmark data also points to mixed operating conditions for dance programs. In iClassPro’s 2024-2025 benchmark study, dance followed the broader trend of lower new-student inflow, roughly 54% trial-to-enrollment conversion, and relatively low average churn of about 15%, although churn rose sharply in summer months.
What These Dance Education Statistics Show
The broad pattern is that dance education has strong demand but uneven access. Dance is available in far fewer schools than music or visual arts, and access improves materially at larger schools and at the high school level.
At the same time, the pipeline extends well beyond K-12 campuses. Adults still learn dance, colleges continue to produce a steady stream of dance graduates, and the studio market remains large enough to play a major role in extracurricular and pre-professional training.
Sources
National Endowment for the Arts and NCES, Arts Education in U.S. Public Schools: Insights from the November 2024 School Pulse Panel Survey
National Dance Education Organization, PreK-12 Schools
Arts Education Data Project, National Arts Education Status Report 2019 summary materials
National Endowment for the Arts, Arts Participation Patterns in 2022
National Center for Education Statistics, Digest of Education Statistics Table 318.30
IBISWorld, Dance Studios in the US Market Size Statistics
IBISWorld, Dance Studios in the US Number of Businesses Statistics
Upgrade your ride with the 10 best car speakers that deliver crisp sound without an amp—discover which models will transform your listening experience!